
Top CI/CD Metrics Every Developer Should Track
This article explores the indispensable metrics that every developer should monitor, ensuring their CI/CD processes are not just functioning but excelling.
Continuous Integration, Delivery, and Deployment (CI/CD), stand at the forefront of modern software development, revolutionizing how we build, test, and deploy code. The efficacy of CI/CD pipelines, however, is deeply rooted in the metrics we track.
This article explores the indispensable metrics that every developer should monitor, ensuring their CI/CD processes are not just functioning but excelling.
The Role of Metrics in CI/CD
Metrics in the realm of CI/CD are far more than mere numbers; they are the lifeline of efficient software development.
By judiciously tracking these metrics, development teams can unearth hidden bottlenecks, refine their workflows, and make informed, data-driven decisions.
The ramifications are far-reaching: enhanced efficiency, superior software quality, and a product that truly resonates with end-users.
Essential CI/CD Metrics to Track
Build Duration
The time taken for a build to complete is a critical indicator of pipeline health. It reflects the efficiency of the integration process. By minimizing build duration, developers can accelerate feedback loops, enabling quicker iterations and faster time-to-market.
Deployment Frequency
This metric signifies the health of the deployment process. Frequent, smaller deployments indicate a robust and agile CI/CD pipeline, allowing teams to respond swiftly to market demands and customer feedback.
Change Failure Rate
A key indicator of the stability of the CI/CD process, this metric quantifies the percentage of deployments that result in a failure in the production environment. A lower change failure rate points to superior testing protocols and more reliable deployment practices.
Mean Time to Recovery (MTTR)
MTTR is a crucial metric that measures the team's ability to respond to and recover from failures. A shorter MTTR not only boosts customer trust but also underscores the team's efficiency in managing production issues.
Lead Time for Changes
This metric offers insight into the overall efficiency of the CI/CD pipeline, tracking the time from code commit to its successful deployment. Optimizing this metric can significantly enhance a company's agility and responsiveness.
Automation Coverage
The extent of automation within a CI/CD pipeline is pivotal. A high degree of automation reduces the scope of human error and accelerates overall processes, leading to more reliable and quicker deployments.
Test Pass Percentage
This metric tracks the percentage of tests that pass in each build. It’s vital for ensuring the quality of code before it moves further down the pipeline.
Code Coverage
This measures the extent to which the source code is tested. High code coverage is often correlated with lower bug rates in production.
Challenges and Best Practices
The path to effectively tracking and interpreting CI/CD metrics is laden with challenges.
Establishing a contextual understanding of each metric and setting realistic baselines are key.
Regularly revisiting and adjusting strategies based on metric trends is a hallmark of continuous improvement in CI/CD.
Implementing and Tracking Metrics
The implementation of these metrics hinges on the right blend of tools and practices.
Modern CI/CD platforms often come equipped with analytics features.
However, for more granular analysis, teams might opt for external monitoring tools.
Visualization tools, such as dashboards, play a pivotal role in translating raw data into intelligible, actionable insights.
Introducing Mergify CI Monitoring – The Game Changer
While solutions like Datadog CI Visibility give you access to data and insights, you still need to interpret them and do manual actions. We decided to change that with CI Monitoring, a new product that, additionally to giving you number analysis, will act to save you time and money.
Mergify CI Monitoring
Mergify CI Monitoring takes CI/CD visibility to the next level. With advanced analytics and machine learning capabilities, it provides predictive insights into your CI/CD pipeline's performance, allowing you to proactively address issues before they impact your workflow.
Let's go deeper into some CI Monitoring features:
CI Dashboard View
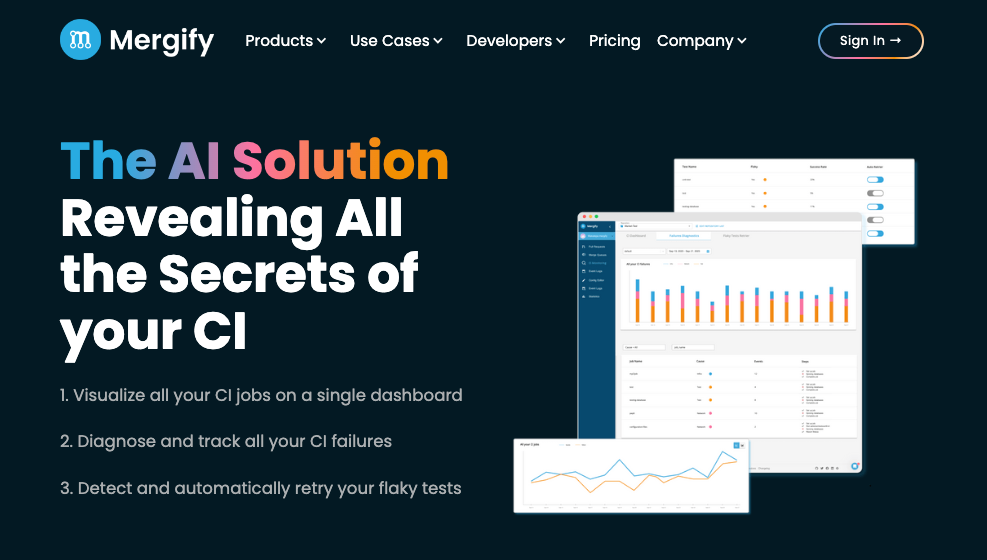
The CI Dashboard feature lets you view the status of your CI as a whole. Thanks to a range of filters, you can focus on the CI jobs that interest you at any given moment.
- Visualize all your CI jobs on a single Dashboard.
- Navigate through the custom date range and state.
- Check your CI's overall condition at a glance.
Logs Analysis
Leveraging the power of AI, CI Monitoring delves deep into logs, providing developers with real-time feedback and actionable insights. Once analysis is over, it's time for CI Monitoring to classify your tests.
Classify and Understand CI Failures
CI failures are annoying, especially when you don't know where they come from or why they happened. The Failure Diagnosis feature allows you to identify the root causes of failure.
- Identify and record all failures.
- Understand root causes: infra, network or tests.
- Find out how to avoid these failures faster.
Conclusion
Tracking CI/CD metrics is not a mere exercise in data collection; it's a strategic approach to refine and perfect the software development lifecycle.
By keeping a close eye on these metrics, developers can turn their CI/CD pipelines into well-oiled machines, delivering high-quality software efficiently and consistently.
Embrace these metrics, let them guide your development journey, and witness the transformation they bring to your CI/CD pipeline.

