
Debugging Database performance issues in a snap with Datadog
Recently, our team experienced a breakthrough in database performance debugging, all thanks to Datadog's automatic explain queries feature. This powerful tool has saved us countless hours and significantly streamlined our debugging process.
In the world of software development, particularly at Mergify, we understand that time is of the essence. Speed and efficiency are not just "nice-to-haves" but crucial to staying ahead in a competitive market. Recently, our team experienced a breakthrough in database performance debugging, all thanks to Datadog's automatic explain queries feature. This powerful tool has saved us countless hours and significantly streamlined our debugging process.
Let me walk you through our real-life scenario, highlighting how Datadog became our database debugging superhero.
Datadog Alerts: The First Sign of Trouble
Our journey into the depths of database debugging commenced with a Datadog alert. The high CPU usage warning was the digital equivalent of a flare shot into the night sky, indicating potential performance degradation lurking in our database's operational depths.
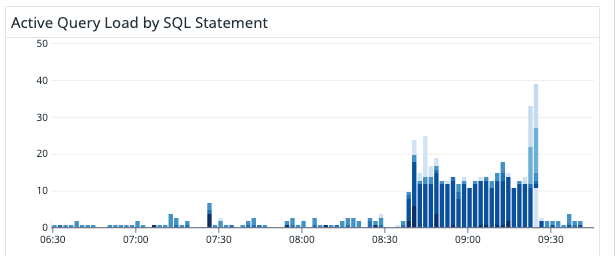
We automatically monitor those kinds of alerts using Datadog monitors, which trigger an alert message on our #prod Slack channel. We make sure those alerts are always under scrutiny.
In this case, the alert indicates that something's wrong with our database being overloaded. Our gut feeling was it was a query problem, overloading the computational power of the database, but we had no clue which query was the problem.
A Glimpse Into the Past: Legacy Debugging Methods
Before the advent of intuitive tools like Datadog, our path from detecting to resolving database performance issues was fraught with obstacles. The legacy method was a multi-step, time-consuming ordeal:
- Reversion and Review: Upon noticing a performance issue, the DevOps team would first have to revert any recent changes to mitigate the immediate impact. This step alone could be a logistical nightmare, often involving coordination across multiple teams and service disruptions that could affect both internal workflows and customer experiences. Imagine having to roll back code and database schemas at the same time.
- Simulating Stress: Developers would then attempt to mimic the database load that led to the problem in a controlled environment. This required replicating the precise conditions under which the issue occurred—a task easier said than done. Without current and relevant data, the accuracy of these simulations could be questionable.
- Database Dumps: To get a true sense of the problem, developers might need an anonymized version of the production database, which means waiting for database dumps to be prepared and sanitized. This not only raised concerns about data privacy and compliance but also added layers of complexity and delay. That process could involve different teams with different scopes.
This antiquated approach was akin to navigating a labyrinth blindfolded, where every turn could either lead closer to the exit or further into the maze.
Instant Query Insights: Pinpointing the Culprit
With the warning from Datadog, our team could bypass the convoluted steps of yesteryear. The queries list within Datadog was like a beacon, guiding us instantly to the heart of the problem—a query that stood out starkly against its peers for all the wrong reasons.
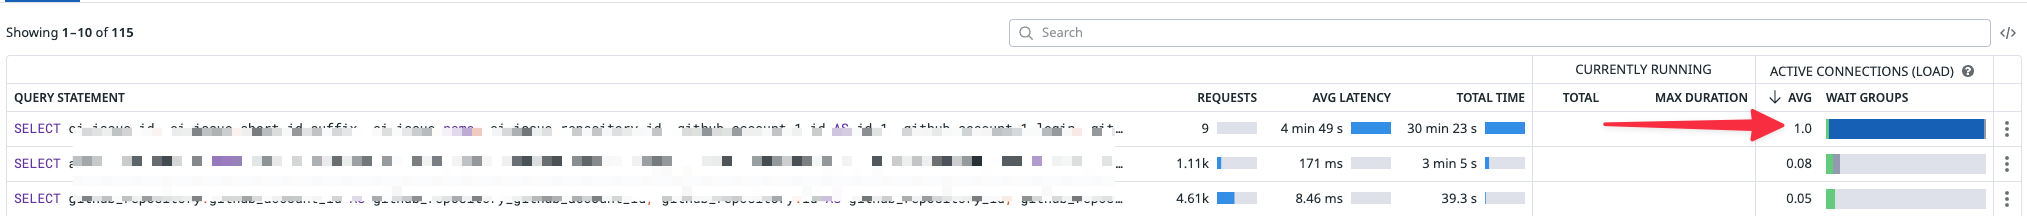
Looking at the report, it was instantly obvious which query was the problem and was overwhelming the database.
Deep Dive with ANALYZE: Exposing the Root Issue
With a mere click, we were presented with the PostgreSQL ANALYZE results via Datadog.
There, laid bare, was the inefficiency at its core.
The detailed breakdown revealed the indexes were not used, and a query was doing a full table scan. Datadog reveals a huge Cost of 3.51M.
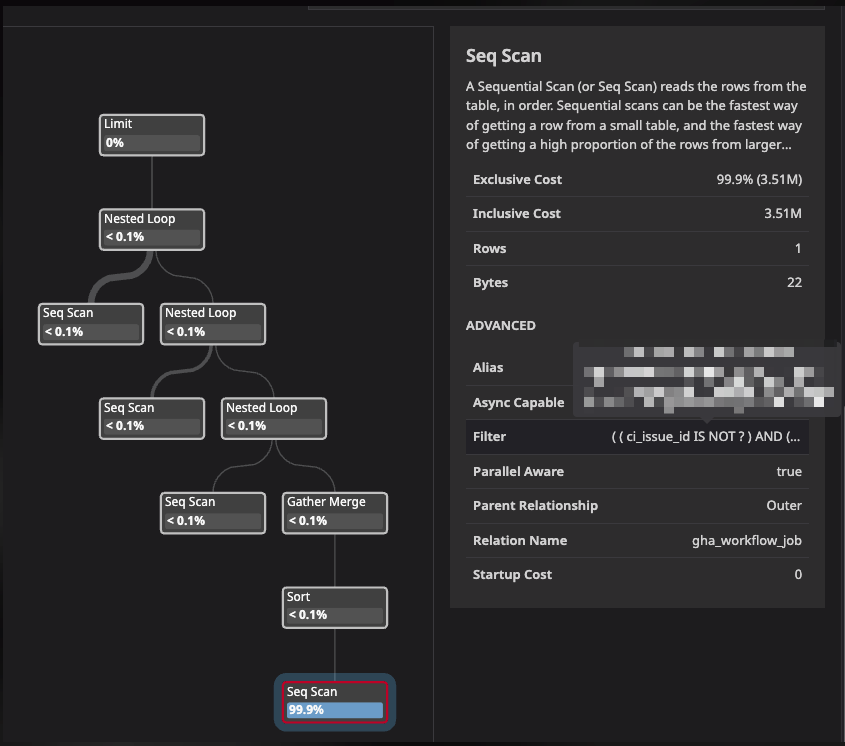
In a few seconds, we could find the root cause and even understand why it was triggered. A process that used to take days was now done in a snap. Now it was time to resolve the problem.
Resolution: Fine-Tuning for Peak Performance
Equipped with targeted insights, we quickly re-engineered the query indexes to remove this full table scan, resulting in a dramatic uptick in efficiency and a substantial decrease in CPU strain.
After creating our indexes and polishing our database, going back to Datadog gave us a new version of those insights:
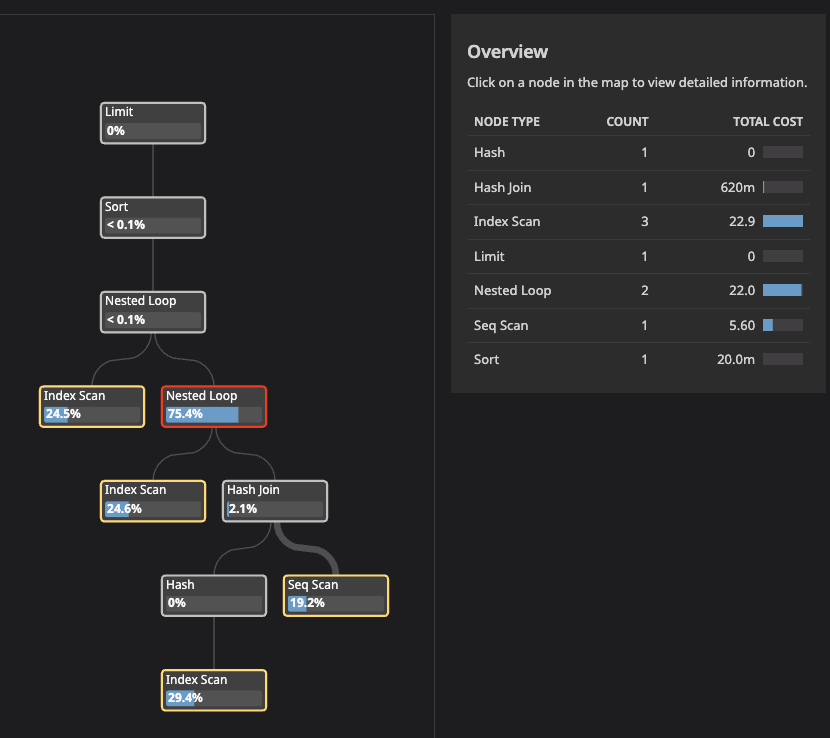
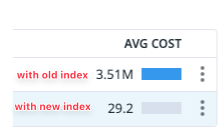
We went from 3.51M to 29.2 query cost, which is only dividing the cost by roughly 120,000. Peanuts.
Conclusion
This is how Datadog reshaped the debugging game for us at Mergify. What once would have been a protracted process involving multiple teams and stages was condensed into a swift and decisive fix. This not only saved us invaluable time but also allowed us to maintain our promise of delivering continuous, uninterrupted service to our clients.
Call to Action
At Mergify, we've seen firsthand how Datadog can transform the daunting task of database performance debugging into a streamlined and almost effortless process. We encourage you to explore Datadog's capabilities and join us in the future of efficient and effective database management.
Don't let legacy methods hold you back—step into an era of clarity, speed, and precision with Datadog's automatic explain queries feature.

